 |
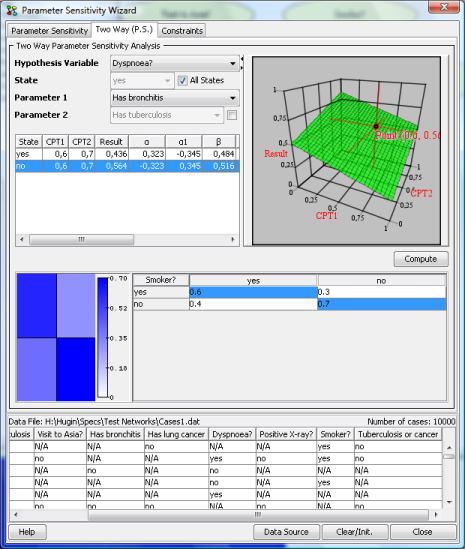
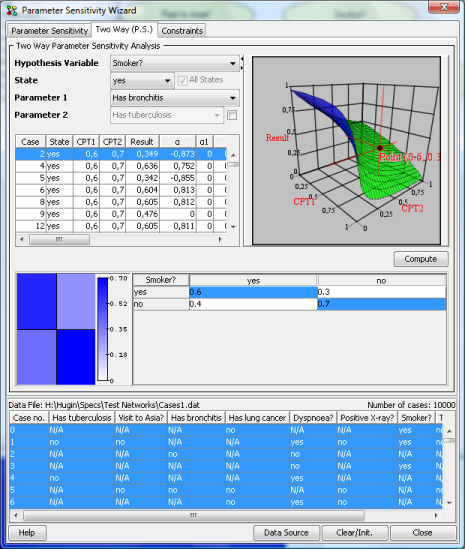
| Figure 1: Parameter Sensitivity Analysis |
Parameter Sensitivity analysis is the analysis of how sensitive the results of a belief update (propagation of evidence) is to variations of the value of a parameter of the model. The parameters of a model are the entries of the conditional probability distributions.
The two way parameter sensitivity analysis observes the resultes of a belief update to variations of the values of two parameters of the model. The parameter values could be entries of the conditional probability distribution from one or two nodes.
The Two Way (P.S) panel performs parameter sensitivity analysis with values from two parameters of the model. On the top left corner there are four drop down boxes that accept user input.
| |
| Figure 1: Parameter Sensitivity Analysis |
When performing parameter sensitivity analysis with two parameters from the same CPT the information table displayed includes the following columns:
 .
. .
.
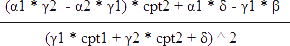
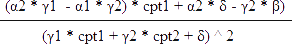
The sensitivity function used to generate the 3D graph is:
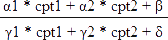 .
.
The Sensitivity values are currntly not computed when performing parameter sensitivity analysis with two parameters from two CPTs.
The "Data Source" button imports cases in the wizard and gives the user the option of selecting a case to be entered as evidence in the domain. Sensitivity analysis can now be performed for each case in the file. In Figure 2, a case file is imported and displayed as a table. When clicking on a case, it is entered as evidence in the domain and after performing sensitivity analysis as shown above (Figure 1), the sensitivity values calculated and the lines in the graph, are different because the new evidence is taken in to consideration.
When cases are loaded in the wizard, it is possible to perform parameter sensitivity analysis across many cases. Selecting all (Ctrl-A) or some cases in the cases table (Figure 2) and then computing the sensitivity for the selected hypothesis and parameters, will generate a table in the information panel that displays the results for all cases. Each row in the table shows the results of the parameter sensitivity analysis for the selected state of the hypothesis, in each case. It is not possible to compute sensitivity for all states of the hypothesis across cases. No results are shown for cases where the computation has failed (fx. when evidence is entered in the hypothesis).
 |
| Figure 2: Sensitivity
computed across cases. |
The information table in addition to the Sensitivity Value, also displays the Parameter Importance value as it adjusts through every case. The parameter importance value at the last row is the final one computed after going through all cases. The parameter importance value is currently not computed when performing parameter sensitivity analysis with two parameters from two CPTs.
Selecting a row in the info table will show the Sensitivity function graph for the selected case.