|
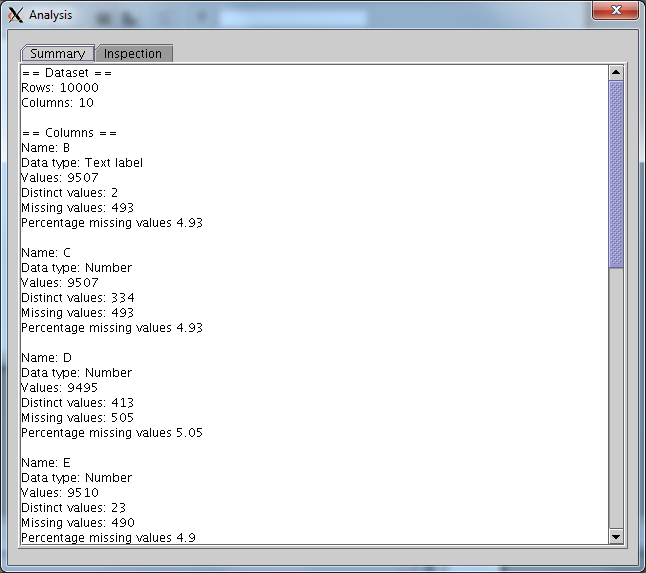
| Figure 1: Summary of data set properties |
The data analysis tool provides summary of data properties and visual inspection of data points. The data analysis tool is available for the data matrix.
A summary of data set properties is found in the summary panel, see Figure 1.
|
|
| Figure 1: Summary of data set properties |
The generated summary reports:
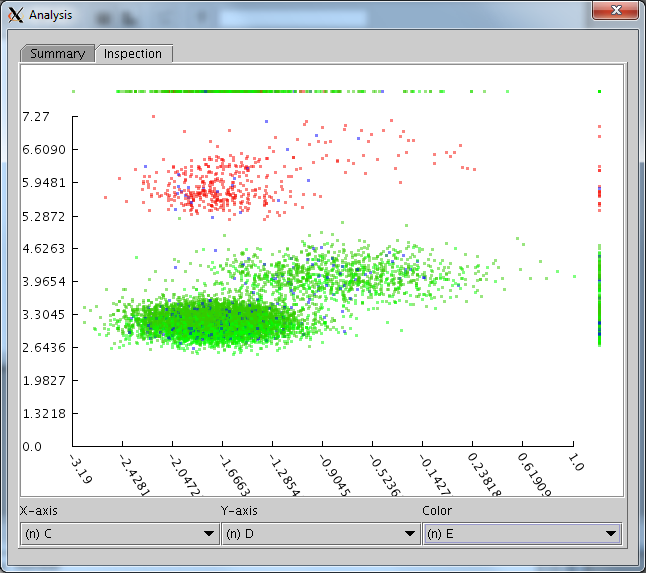
The inspection panel provide visual inspection of data points by plotting all values from selected columns in a single chart.
Depending on the data type of the selected columns, the chart may take the form of a set of dots (numerical data X numerical data), lines (numerical data X discrete data) or a grid (discrete data X discrete data).
The inspection panel in Figure 2 has a plot generated from numerical data.
|
| Figure 2: Inspecting plot of numerical data points - missing data is plottet outside chart |
A total of three columns can be used to generate the chart: X-axis, Y-axis and coloring. Columns can be selected from the three drop-down lists. The drop-down lists contain column names, prefixed according to data type with either (n) for numerical data, (i) for interval, or (t) for text labels.
Missing data go outside the chart following these rules:
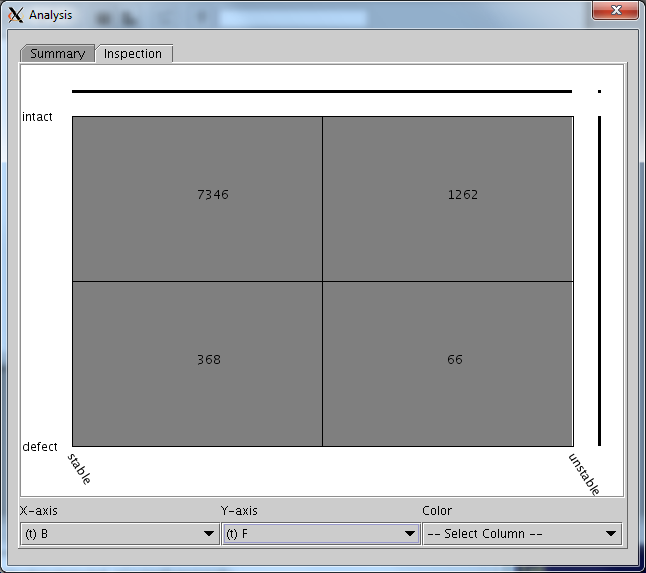
The inspection panel in Figure 3 has a plot generated from discrete data, with counts for each configuration.
|
| Figure 3: Inspecting plot of discrete data points (text labels, intervals) - counts display the number of times each configuration occurs |